AI search visibility metrics KPIs
AI search visibility metrics KPIs are five numbers you compute yourself: readiness score, mention rate, average position, share of voice, and cited source domains. Each one has a formula, a sampling window and a trap. None of them come from an engine, because no engine publishes them. Therefore you own the definitions, and you also own the error bars.
By The Promptscope team (Product and testing). Last updated .
How to set a baseline for these numbers, step by step
- Type a domain into the box above, for example npmjs.com, and run the readiness check first.
- Wait for the score, then note both the number and the blocked crawler flag as your baseline.
- Then run the mention check on the same day, and record mention rate as a fraction rather than a percentage.
- Finally, repeat both on a fixed schedule, because a number without a date is a screenshot, not a KPI.
The first 3 runs each day are free. After that, see the pricing page for packs and plans, or read how we test the tool.
AI search visibility metrics KPIs run against a real site
We pointed this checker at python.org and kept what came back. So the card below is an actual report rather than a mockup, and you can run the same check yourself and compare.
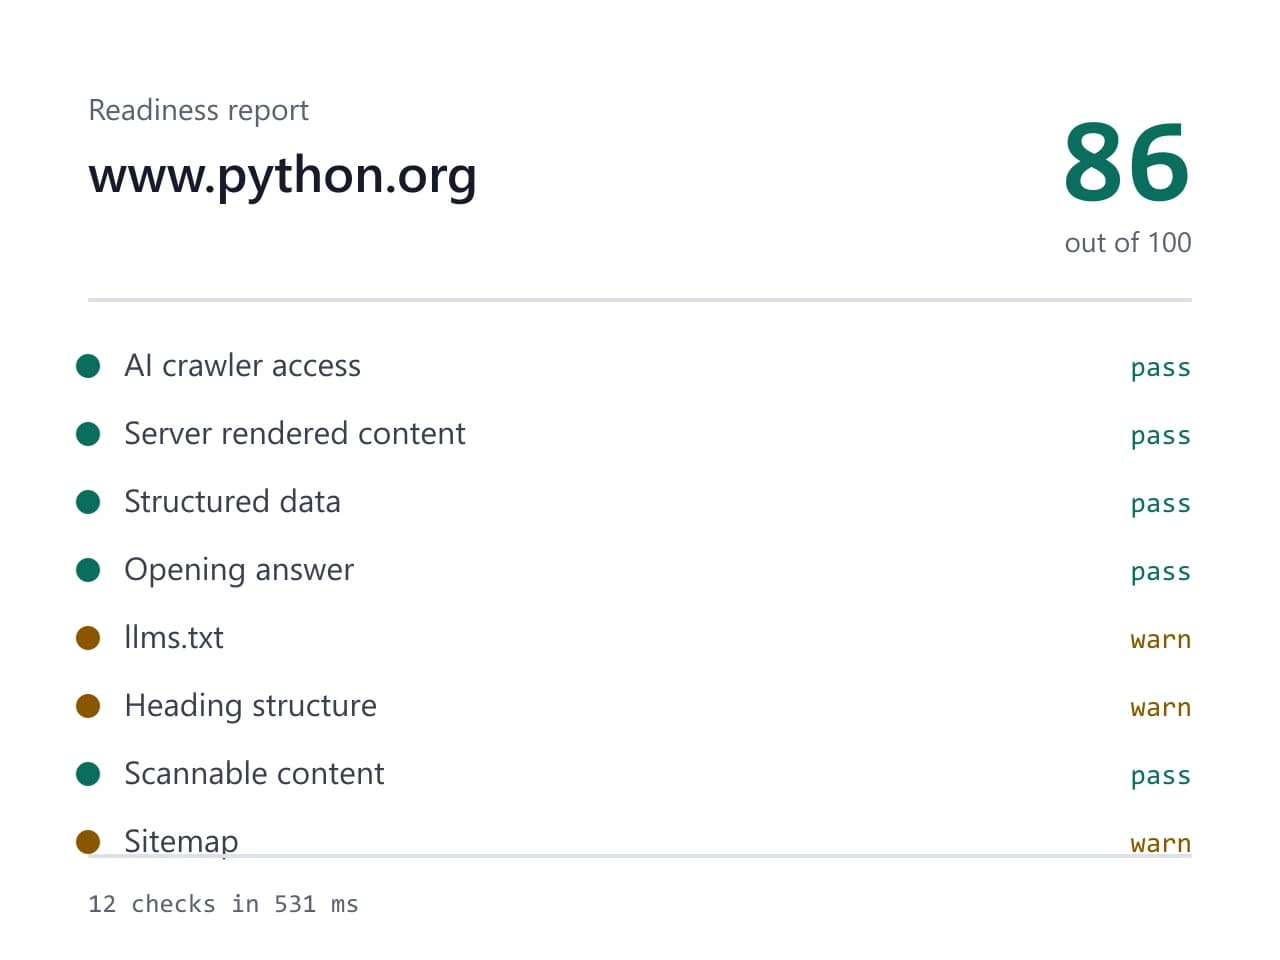
- Site we checked
- python.org
- Readiness score
- 86 / 100
- Checks run
- 12
- Needs a fix
- 0
- Warnings
- 4
- AI crawlers allowed
- 8 of 8
- Checked on
- 2026-10-16
How we test: every page runs the same checks against a different real site, and we read each report by hand before publishing it. More on the about page.
AI search visibility metrics KPIs, defined one by one
Start with the readiness score, because it is the only number here that needs no model at all. The checker runs twelve weighted checks and returns a value from 0 to 100. A blocked AI crawler acts as a gate rather than a row. Therefore the cap lands at 25 when robots.txt blocks every bot, and at 60 when it blocks only some. Above 80 is a fair target for a marketing site. However, the trap is plain: readiness tells you whether an engine can read you, not whether it names you.
Mention rate needs a model run. Divide the answers that name your brand by the answers you parsed. Four mentions in a run of twelve prompts is 33 percent, so write it as 4 of 12 instead. For a known brand in a narrow category, anything above 30 percent is healthy. In a crowded category, 10 percent can still beat every direct rival. The trap sits in the denominator. Drop the prompts that returned nothing useful, and your rate climbs while your real visibility stays flat.
AI search visibility metrics KPIs beyond the mention rate
Average position is the mean rank of your first mention, and it counts only answers that named you. If a model lists five tools and you sit third, that answer contributes a 3. Answers without your brand contribute nothing, because an absent brand has no rank. As a result, the metric can move the wrong way for a good reason. Win two extra mentions at rank 5, and your average gets worse while your visibility improves. Therefore print it next to mention rate every time, or leave it out of the report.
Share of voice compares you against the brands that keep coming back. Count every brand mention in the run, then divide yours by that total. Limit the competitor set to brands that appear in two or more answers, since a single mention is noise. Cited source domains are a different animal: they are the domains a model links or names as evidence. Count each domain once per answer, because one answer can repeat the same site three times. That list names the publications an engine trusts in your category, so it doubles as a PR target list.
What these numbers cannot tell you
Every number here comes from sampling, and you report it yourself. No answer engine publishes mention rate, position or share of voice. A tool that shows them is sampling model answers and doing arithmetic. That is honest work, although it is not analytics. So treat the output like a poll rather than a server log. Also remember that models change under you. A provider can ship a new version overnight, and your numbers move without a single edit on your site.
A rate over twelve prompts carries wide error bars. Moving from 3 of 12 to 4 of 12 looks like an eight point jump. However, that is one answer, and it sits well inside normal variation. So wait for a change of roughly three answers before you call anything a trend. You can also run the same prompts on different days and average the results. The readiness half has its own limits, since it reads one URL at a time and parses server rendered HTML. Content that appears only after JavaScript runs will look missing here.
Vanity numbers, and what to report to a manager
Some numbers feel great and decide nothing. A raw count of mentions is the first one, because it grows whenever you run more prompts. Average position alone is the second, for the reason above. Total citation counts belong in the same bin, since a scraper site and a trade publication carry different weight. Screenshots of one lucky answer are the worst of the set, although they travel furthest in a group chat. None of these four survive a follow up question from anyone paying for the work.
Report four things instead. Keep the AI search visibility metrics KPIs in one fixed format, so they compare month to month. First, mention rate as a fraction, such as 4 of 12. Next, share of voice against a named competitor set. Then the readiness score with the blocked crawler flag beside it. Finally, one line on what changed on your site since the last run. A manager can act on that, because every line points at either a fix or a rival.
Five metrics, plus the three inputs that make them readable
| Metric | How to compute it |
|---|---|
| Readiness score | weighted pass rate over twelve checks, 0 to 100, capped at 25 or 60 while a crawler stays blocked |
| Mention rate | answers naming your brand divided by answers parsed, so 4 of 12 is 33 percent |
| Average position | mean rank of your first mention, using only the answers that named you |
| Share of voice | your mentions divided by every brand mention in the same run |
| Cited source domains | unique domains a model links or names as evidence, counted once per answer |
| Sample size | twelve fixed prompts per run, so one answer shifts the rate by about eight points |
| Competitor set | brands appearing in two or more answers, held steady from run to run |
| Blocked crawler flag | yes or no, because a yes makes every other number here unreliable |
AI search visibility metrics KPIs FAQ
Which AI search visibility metrics KPIs actually matter?
Five: readiness score, mention rate, average position when named, share of voice against a stable competitor set, and cited source domains. Readiness is the one you fully control, so it belongs at the top of the list. The other four describe how models answer buyer questions today, and they move for reasons outside your site.
How do you calculate mention rate?
Divide the answers that name your brand by the answers you parsed, then report the result as a fraction. A run of twelve prompts with four mentions is 4 of 12, or 33 percent. Keep the denominator fixed, because dropping weak prompts inflates the rate without changing anything real.
Why is average position misleading on its own?
Because it counts only the answers that named you. A brand mentioned twice at rank 2 shows a better average than a brand mentioned nine times at rank 4, although the second brand is far more visible. So always print mention rate beside it, and treat any position change under one full rank as noise.
How many runs before a change counts as a trend?
One answer out of twelve is noise, so treat a swing of one or two answers as flat. A move of roughly three answers, repeated on a second run, is worth investigating. For steadier numbers, run the same fixed prompts on different days and average them before you draw a line on a chart.
Do ChatGPT or Perplexity report any of this?
No. None of the answer engines publish mention rate, position or share of voice for your brand. Every tool in this space samples model answers and computes the numbers itself, so treat them as survey results with error bars. Readiness is the exception, since it comes from your own files and your own robots.txt.